Power is Nothing Without Control
 Airedale by Modine Controls Division Release Intuitive Power Event Mapping Features as Part of ACIS Facility Management System
Electrical faults are the scourge of any data center operations team. They are also, due to the complexity of the power systems deployed in data centers, unfortunately inevitable. Getting power back online quickly after a fault is absolutely key to keeping the facility within those critical customer SLAs, but once the dust settles, a thorough investigation into the root-cause is imperative.
Power Management Systems may not be the first thing that come to mind when you think of Airedale by Modine, but Airedale’s Controls division has decades of data center experience under their collective belts. After working closely with data center facility management teams over the years and seeing some common issues with power supply and route cause analysis of faults, have developed some powerful tools that go far beyond any on the market today.
What is the challenge?
Large data centers usually have 2 separate (A & B) power supplies, right up to the rack. Critical loads are protected by a UPS on each supply and protection is coordinated so that the nearest device to the fault trips first. Overloaded circuits, grid faults, rotary UPS, harmonics, storms, poor connections and human error can all cause trips. Add this level of risk to the fact that even the lowest tier Data Centers (Tier 1) have to deliver 99.671% availability, and the problem is obvious.
Out-of-the-box Building Management Systems (BMS) are great at the monitoring and reporting of events in the data center. A trip can raise an alarm notification so that operators can quickly attend to the problem component. BMS software platforms that monitor power & cooling systems are readily available, but there is a difference between monitoring and managing. To truly manage a system, you need to understand it. Not many BMS providers are true power & cooling experts.
This all comes to a head with a common phenomenon seen in data centers: cascading trips. During a power event, one circuit experiences a fault, the nearest breaker trips and this causes a ripple effect of subsequent trips as other devices see anomalies on their circuit. In a lot of cases, data center operators will deploy a separate Power Management System (PMS) to keep an eye purely on electrical infrastructure. Even with these dedicated systems though, it is often difficult to see the root-cause of power events through what is often a sea of alarm notifications.
Airedale controls experts have seen this many times on live sites. The faults themselves are not fatal; the built in redundancy does its job, no components suffer damage, the system is reset and power is restored. However, the lack of effective root-cause analysis means the end-user customers are starting to lose trust in the operators. How can you guarantee uptime if you don’t know what is causing the faults?
The Solution
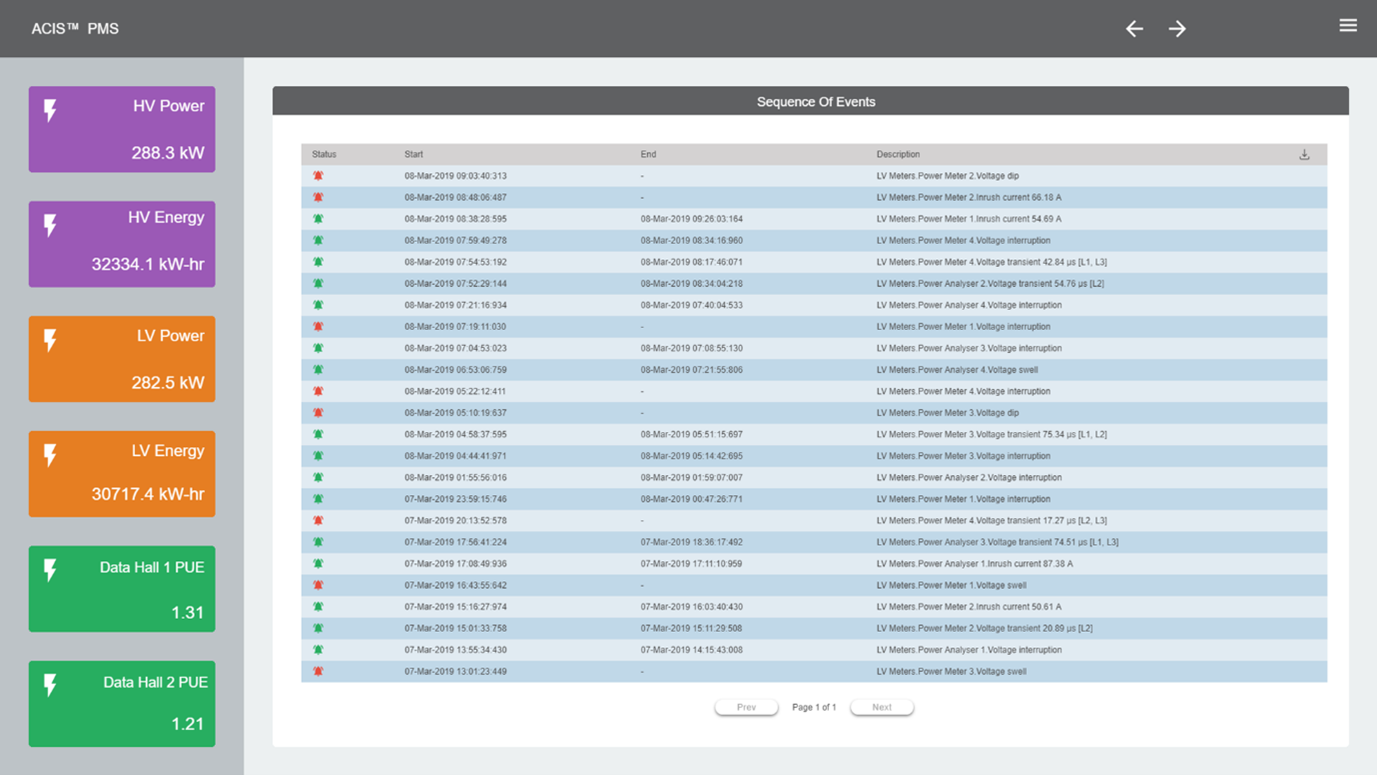
- Sequence of Events
It is critical that the PMS can detect electrical event propagation throughout a data center installation. Operators need to be able to see the event itself, whether it be a sag, a swell or a complete interruption. Then, it is key that any protection component, be it an ACB or MCCB, has monitoring and metering that detects the opening of the device. These trip events must be timestamped, with meters synchronised within 10ms in order to determine the sequence (order) of occurrence. The head-end system must then have the ability to subsequently interrogate these meters and display the event propagation.
- Impact of Events
Being able to interrogate the sequence of trips allows the operator to see the first device that tripped and how that then propagated through the system. However, it is also important to understand the impact that specific alarms / voltage events had on a facility, particularly on sensitive equipment. In order to provide these insights, a separate sub-function of the PMS is needed, that plots electrical events on a CBEMA curve allowing user to prioritise serious events. The CBEMA curve is used to visibly represent voltage events and is a common format for reporting power quality variation data. It is a susceptibility profile with the horizontal axis representing the duration of the event, while the vertical axis indicates the percent of voltage applied to the power circuit.
It was developed by the Computer Business Equipment Manufacturers Association to describe the tolerance of computer equipment to the magnitude and duration of voltage events in power systems.
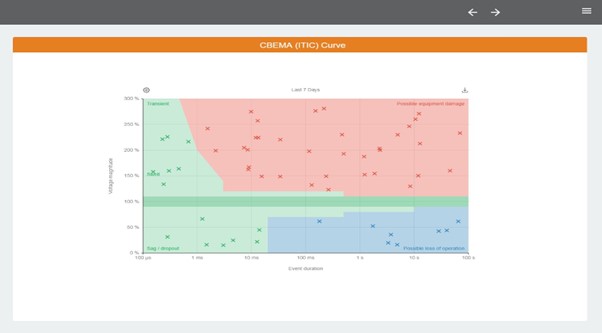
The green area in the center of the graph represents the acceptable area. Events in the red area cause issues such as insulation failures and overvoltage trips. Events in the blue envelope cause the load to drop out due to lack of energy. The key to the chart is the event duration and the fact that if certain voltage events persist for longer, then more issues can arise with sensitive equipment.
This function allows operators to pinpoint the events that had the potential to cause the most severe problems for IT equipment, allowing for corrective action and responsibility to be apportioned correctly.
Using the same data, Airedale have developed a “Voltage Events Intensity Chart” as an alternative visualisation tool. This displays the number of events over time to aid operators in further root-cause analysis.
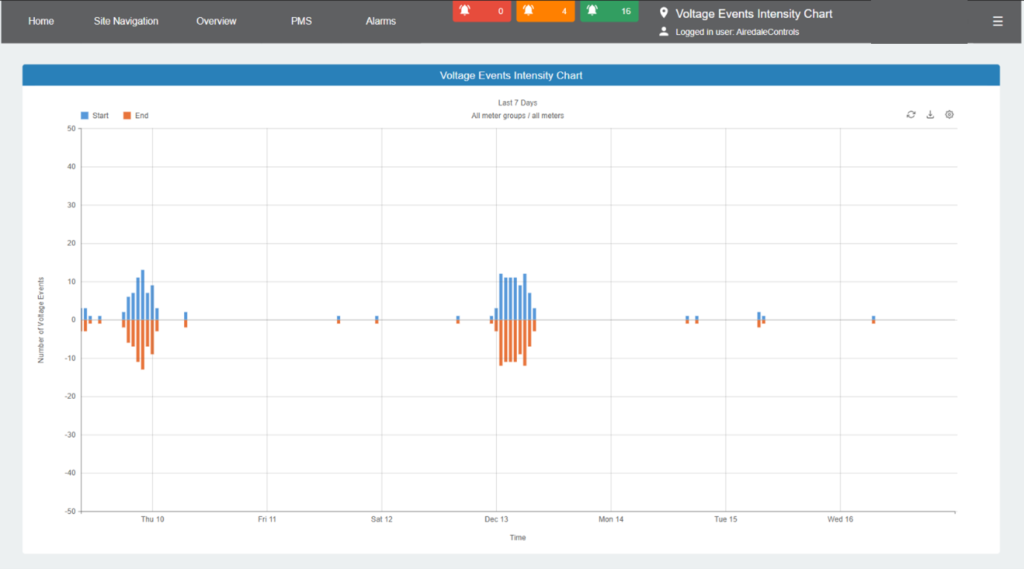
Voltage Events Intensity Chart
Summary
A data center is essentially a mini self-contained power grid, with generation, distribution a protection system, metering and end-users. As with any grid, faults can occur anywhere and the job of the protection system is to protect sensitive and high-value equipment from harm.
Analysis of events in order to determine root-cause is absolutely key to ensuring problem components are identified and customers informed of corrective actions. It is also important to analyse power events in order that future events can be predicted / avoided.
Airedale’s experience in data centers and ability to build out intuitive functionality on the Tridium-based ACIS platform has resulted in a PMS that stands on its own as a leading edge monitoring and management tool. It can be deployed as a standalone system but our philosophy is always to create “singe pane of glass” head-end systems with power monitoring, building management and energy management in one Facility Management System (FMS). We may not be the first name you think of when considering power management, but we are data scientists and data center experts. As with any software platform, interpretation of raw data is key rather than just presenting it. We believe that even in the events-heavy world of power management, we have developed a tool that collects, interprets and displays data better than most in the industry.
Airedale ACIS PMS
Through powerful insight tools and technology partnerships we can get you to the answers you need faster than ever before.
- Monitoring of all HV and LV devices from any manufacturer
- Electrical power totalisation across the system
- Live power schematics
- Insightful reporting tools.
- Accurately ascertain the root-cause of electrical events, such as cascading trips, with 1ms time stamping of events.
- Cut through the noise of lists with graphical representation of trips vs. time, allowing the user to see “hot spots” of anomalous activity and assess magnitude of events
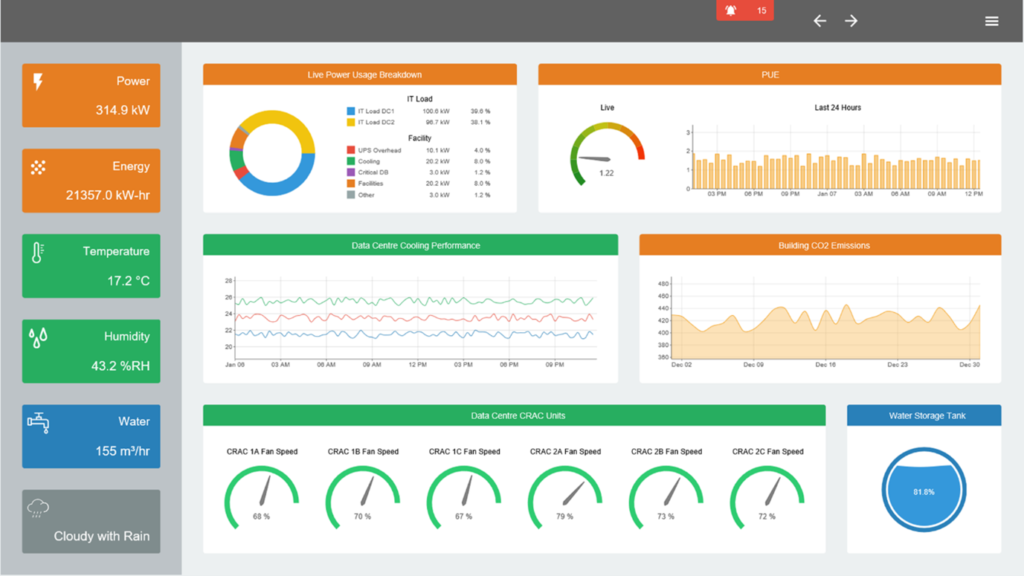
- See live and historical Power Usage Effectiveness (PUE) of your facility in order to track changes and maintain Tier classification.